Meet Our 2015 Photo Contest Winners
par Robin Deissinger | Mis à jour le : 10/28/2015 | Commentaires : 4
We asked our integrators, those folks who sell and install our products, to send us their best photos of Campbell Scientific equipment operating in the field. From all of their submissions, we selected a photo from Western Weather Group as the first-place winner. Runners-up photo entries were submitted by RESPEC, YSI, and Wade Water LLC.
The photo contest winners were announced at the 2015 training conference for integrators, held October 12th to 14th in Logan, Utah. The photographer of the winning entry, Matt Wanink, was not able to attend the conference; however, Nathan Lohse, general manager at Western Weather Group, was in attendance and accepted the prize on Matt’s behalf: a CR6 Measurement and Control Datalogger (our newest data logger released last year).
First-Place Winner Spotlight: Western Weather Group
Western Weather Group (WWG) is the California sales representative for Campbell Scientific. WWG was founded 10 years ago in Chico, California. Since the company’s inception, its team members have used and worked with Campbell Scientific instruments. In fact, members of the WWG team, including CEO Don Schukraft, have used Campbell products since the early 1980s under their previous employers.
WWG installs systems along the West Coast, as well as in Hawaii, for a multitude of organizations ranging from agricultural (grapes, rice, almonds, walnuts, citrus, sugar cane, corn, etc.) to industrial (power plants, oil refineries, and utility companies) and governmental (wastewater treatment plants, state/city parks, etc.).
When asked what he planned to do with the new CR6 datalogger, Matt said that the CR6 would provide an upgrade to their current weather station at the WWG office, which uses a (now-retired) CR10X datalogger.
Application Background: The Photo
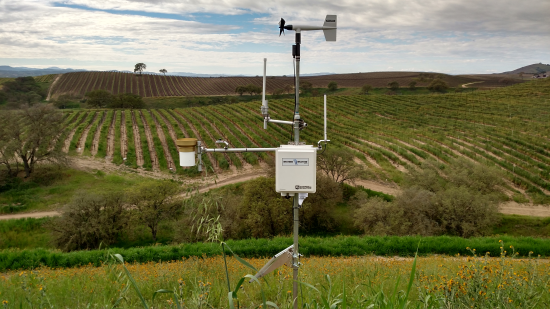
In the early spring of this year, Matt took the winning photo of a Campbell Scientific system in a vineyard. The vineyard is located just north of Paso Robles, California, along the Central Coast. In the winter, the system will be used for frost alarms to prevent frozen grapes. In the summer, the system generates heat alarms, which are necessary for heat regulations that protect California’s outdoor workers.
In addition to generating frost and heat alarms, the vineyard system measures and records data for a variety of parameters. For example, rainfall measurements are important for irrigation scheduling. As another example, wind speed and wind direction measurements are useful for managing spraying (such as pesticides and fungicides) across the vineyard. Specific parameters measured by the vineyard system include the following:
|
|
The measurement data is aggregated in tables for 15-minute, hourly, and daily intervals. The client is able to see and review the real-time data on an internal web page.
To acquire the necessary measurement data and communicate that data to the client, the following Campbell Scientific equipment is used:
- CR800 datalogger
- LoggerNet Admin support software
- ENC14/16 enclosure
- RAVENXTV cellular digital modem and 14394 mounting kit
- COM220 phone modem
- RF401A spread-spectrum radio and 14162 mounting kit
- 14221 omnidirectional antenna
- SP20 solar panel
- BP24 sealed rechargeable battery
- HC2S3-L temperature and relative humidity probe
- LI200X-L silicon pyranometer and CM225 solar sensor mounting stand
- TE525WS tipping-bucket rain gage
- 05103 wind monitor
- CM204 crossarm and bracket
- 3659 unthreaded aluminum pipe
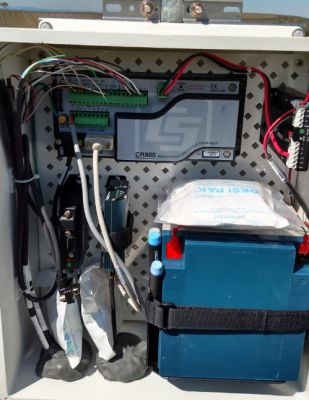
An inside view of the vineyard system’s enclosure.
Photo supplied by Matt Wanink.
Additional Application Information
The base station in the vineyard photo communicates via radio with a remote CR206X datalogger that has a built-in spread-spectrum radio and is connected to a temperature sensor. This data logger and sensor are situated in a lower spot of the vineyard to provide additional, valuable temperature data during the frost season.
WWG collects data every 15 minutes from the networked vineyard system, as well as from several hundred other systems in the area. The raw data are aggregated, and WWG hosts the processed data in these formats:
- Graphical/tabular database
- Publicly viewable weather web page
- Mobile app
- Regional Google Earth map displaying weather data
Western Weather Group uses weather data recorded by Campbell Scientific instruments for regional and site-specific weather forecasting. For example, WWG uses the data from the vineyard system in their daily spring frost forecast that they issue to members of the Paso Robles Wine Country Alliance.
Runners-Up
In addition to our first-place winner, we also selected photo entries for second, third, and fourth place, as well as an honorable mention. Our congratulations go to these four runners-up for their compositions that combine Campbell Scientific systems, great photography, and great settings.
Second-Place Winner
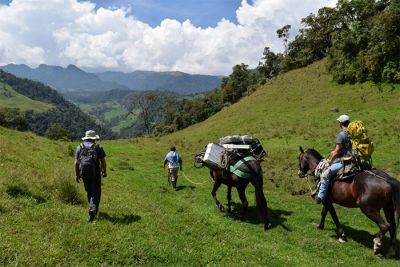
This second-place photo, with an SM-19 Skymate Plus wind meter as the prize, was taken by Kerry McCallum of Dewhurst Group, who partnered with RESPEC to complete the installation. In this photo, a team transports the equipment for a stream-flow deployment in the valleys below the Nevado del Ruiz volcano in Colombia. The deployed station is located 518 m (1,700 ft) below where this photo was taken. The station communicates with an upslope weather station via an RF450 spread-spectrum radio.
Third-Place Winner
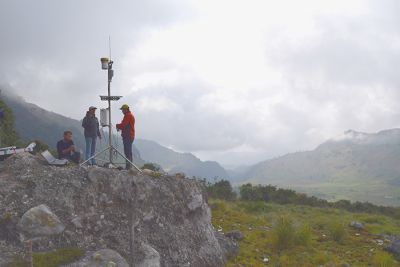
This photo by Kerry McCallum of Dewhurst Group was selected for third prize: a Campbell Scientific jacket. RESPEC partnered with Dewhurst Group to install the weather station in this photo, which is situated at an elevation of 3,627 m (11,900 ft) on the western slope of the Nevado del Ruiz volcano in Colombia. The station was installed as part of a geothermal investigation. The station uses a CR1000 datalogger, an LS300G cellular gateway, and standard weather station equipment (rain gage, solar radiation sensor, barometer, air temperature and relative humidity sensor, and wind monitor).
Fourth-Place Winner
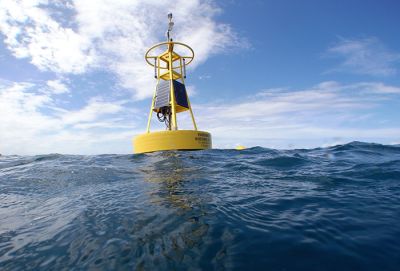
Jon Fajans of Xylem’s YSI Integrated Systems and Services (ISS) division won an SM-18 Skymate wind meter for this photo taken in Discovery Bay, Jamaica. This surface oceanographic buoy includes two CR1000 dataloggers, which communicate with the benthic sled positioned on the lowest level of the water below. The benthic sled has a CR1000 datalogger and an SDM-SIO4 serial I/O module, which control the oceanographic instruments.
Honorable Mention
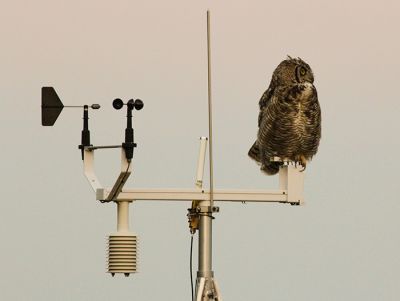
Stephen Smith of Wade Water LLC and Buena Vida Farm was the recipient of a Campbell Scientific fleece blanket for this photo of a great horned owl enjoying a vantage point and perch atop a weather station.
More Information
For more information about our integrators and consultants, who can assist you with the installation of your measurement and control systems, visit our Consultants and Integrators web page.


A propos de l'auteur
 Robin Deissinger est spécialiste du contenu Web chez Campbell Scientific, Inc. Elle crée et maintient le site Web et elle gère le programme des médias sociaux de l'entreprise. Robin s'occupe du blog de Campbell Scientific et contribue occasionnellement à des articles sur le blog. Elle a obtenu un baccalauréat en communication de l'Université Bradley.
Commentaires
dougdziubla | 10/29/2015 at 09:05 AM
How are they measuring powerdy mildew? That's a new one for me.
Robin D | 11/02/2015 at 08:31 AM
dougdziubla, I apologize for the delay in receiving an answer to your question. Matt Wanink of Western Weather Group attempted to respond to you the same day, but his response was not saved and displayed. We should be able to get his response posted very soon. Thanks for your patience.
Robin D | 11/02/2015 at 11:06 AM
Matt Wanink of Western Weather Group has the following information to share:
Powdery mildew is a common disease on many types of plants and is prevalent under the diverse conditions found in many areas of California. Western Weather Group has an equation to calculate the PM stress points for the growers. This is then outputted. Here is what the equation does, described by the UC Integrated Pest Management:
1) The start of the conidial stage of the model is triggered early in the growing season by three consecutive days with six consecutive hours of temperatures between 70 and 85 F; for each of these three days, the model assigns 20 points to the disease risk index.
2) The conidial infection index increases by 20 points on each subsequent day where at least six continuous hours of temperatures between 70 and 85 F occur.
3) If there are less than six consecutive hours of temperatures between 70 and 85 F, 10 points are subtracted from the index. This is the case if the temperature falls below 70 or goes above 85 for more than 45 minutes, since this amount of time is considered to break the accumulation of conducive temperature hours.
4) If the temperature is 95 F or higher for at least 15 minutes, 10 points are subtracted from the index for the day.
5) If on the same day with 6 continuous hours between 70-85 F the temperature exceeds 95 F for 15 minutes or more, then the model adds 20 points for the six hours but subtracts 10 points due to the high temperature. Thus, for that day the model adds 10 points.
6) If after subtracting a day's points the index is less than zero, reset the index to zero. If after adding a day's points the index is greater than 100, reset the index to 100.
7) On any one day the index should not decline by more than 10 points or increase by more than 20 points.
dougdziubla | 11/03/2015 at 12:02 PM
Very interesting! Thanks for sharing!
Please log in or register to comment.